Protocol
- Memory Analysis
- Organ Weights
- Histochemical studies
- Hematoxylin and Eosin (H & E) staining
- Cresyl Violet (CV) Staining
- Western Immunoblotting Analysis
- Immunofluorescence confocal microscopy
- Double immunofluorescence confocal microscopy
MEMORY ANALYSIS:-
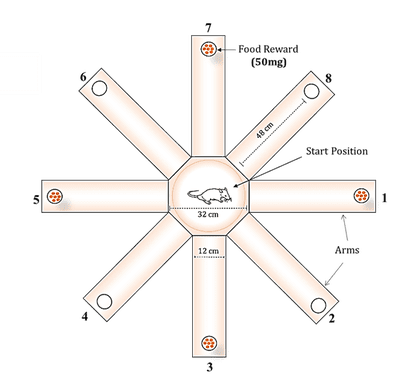
8-Arm radial arm Maze Task: Behavioral analysis was performed as described by Wincott et al., (2014) with slight modifications. Rats were tested in a radial 8-arm maze for the present study. It contains eight arms numbered from 1 to 8, each arms (48 X 12 cm) extending outward from a central platform (32 cm in diameter). A circular feeding cup was placed at each arm end, where bait was placed at the beginning of each trial. The setup was placed 80 cm above the floor, surrounded by various extra maze visual cues (Triangle, square and circle) that were positioned at every spaced intervals of the maze walls. Cues remained constant throughout testing.
Prior to the performance on the maze task for behavioral analysis, the animals were restricted to partial food deprivation schedule and body weight was maintained at 85% of their free-freeing weight over a week period, with water being available ad libitum. Subsequently they were fed 12-15 gm /day to maintain rats in this particular weight. Maze adaptation started after one day of food deprivation. To avoid transport related stress, animals were relocated from the animal house to the testing room 30 min before the behavioral assessment at the beginning of each testing day. Three rats were simultaneously allowed to explore the eight arm maze for 15 min on 3 consecutive days. The food pellets were randomly scattered over the entire maze surface. On 4th day, four of the eight arms (no. 1, 3, 5, 7) were selected and food pellets were scattered. On the 5th day, pellets were placed in the food feeding cup at the end of the 4 assigned arms. The number of baited arms and the spatial location of the baited arms relative to the room, remained constant throughout the study. This provided the reference aspect of maze performance. The arm, first visited by the animal was observed.
After adaptation, to evaluate basal activity of rats in radial eight arm maze, rats were given 5 consecutive training trial per day during which a single food pellet was placed in the food cup of the 4 arms assigned to be baited. Each rat was placed on the center platform facing randomly selected arms for each trial and allowed to make arm choices until either all 4 pellets were taken or until 5 min. Immediately, after a trial the rat was returned to its home cage, and given its additional food for the day. To prevent intra-maze cues (odor cues), the maze was cleaned (using 50% ethanol solution) between each test. Arm entries by the rats into baited arms as well as non-baited arms were recorded for the analysis.
For behavioral analysis of maze performance, an initial entry of food baited arm was considered a correct choice, and the foremost entry of an unbaited arm was considered a reference memory error (Long term memory), and reentry of a previously chosen arm was considered a working memory error (short term memory). Thus, the reference and working error rate are made. The time taken to consume all four baits was also recorded. All the behavioral trials were carried out between 8 AM and 12 PM. The percentage of correct response was calculated by using the following formula,
% of correct response = number of correct response/number of trials X 100
Organ weights:-
All animals were weighed prior and following the suspension period to determine total body mass changes. After completion of final behavioral analysis, all the animals were sacrificed under mild anesthesia. Liver, kidney and brain from both control and RSV treated group animals were dissected, blood vessels and connective tissues were trimmed and rinsed with ice-cold saline (0.9% NaCl). Tissues were blotted free of any fluid using Whatman Filter paper No. 40, weighed and used for analysis. Based on the wet weight (absolute weight) and body weight, the organ-to-body weight or organ-to-brain weight ratio (relative weight) was calculated as follows:
All animals were weighed prior and following the suspension period to determine total body mass changes. After completion of final behavioral analysis, all the animals were sacrificed under mild anesthesia. Liver, kidney and brain from both control and RSV treated group animals were dissected, blood vessels and connective tissues were trimmed and rinsed with ice-cold saline (0.9% NaCl). Tissues were blotted free of any fluid using Whatman Filter paper No. 40, weighed and used for analysis. Based on the wet weight (absolute weight) and body weight, the organ-to-body weight or organ-to-brain weight ratio (relative weight) was calculated as follows:


Histochemical studies:-
Animals were perfused intracardially with PBS, for 2 min followed by 10% (w/v) neutral buffered formalin (NBF: 100ml formaldehyde (37-40% stock solution), 4g/L NaH2PO4, 6.5g/L Na2HPO4, 900ml H2O; pH 7.0) for pre-fixation of the tissues another 5 min. The brain was dissected out carefully and kept in ice-cold plate immediately according to the guidelines of Glowinski and Iversen (1966). The excised regions were isolated and washed with normal saline followed by 10% NBF in 1 X PBS and stored in 10% NBF overnight at room temperature (RT) for post-fixation. The tissues were dehydrated in gradient alcohol solutions (30%, 50%, 70%, 80% 90% and 100%). Dehydration was followed by clearing the samples in 2 changes of xylene (Sulphur free). Samples were then impregnated with 2 changes of paraffin-wax, then embedded and blocked out. Blocks were prepared and coronal sections of 5μm were made using rotary microtome (Leica RM 2255, Lab India) and mountated on 3-aminopropyltriethoxysilane treated slides and kept in 37°C overnight.
Hematoxylin and Eosin (H & E) staining
A histopathological study was conducted according to Li et al (1998). H & E staining used to evaluate age-associated pathological changes in Liver, Kidney and brain tissues from both control and RSV treated animals. Based on the SURS, selected paraffin sections were deparaffinized in xylene for 30 min, rehydrated in serial concentrations of ethanol solutions (100%, 90%, 80% and 70%) and washed with 1X PBS then placed in deionized water (D.H2O) for 5 min. Hematoxylin solution for 10 s and washed with running tap water for 5 min and washed with 90% ethanol then stained with 0.25% of eosin solution for 1 min, sections were dehydrated in graded ethanol (90% & 100%), cleared with xylene and coversliped with DPX. Stained sections were captured using light microscopy (Weswox Optik) at 10X and 40X magnification.
Cresyl Violet (CV) Staining
Aged rats with poor memory performance (as evidenced in RAM analysis) was chosen for analyzing age-associated pathological alterations in specific brain regions. Based on the SURS, random brain sections were made and stained for Nissl bodies with Cresyl violet (CV) to evaluate the morphological changes of the brain and also to localize the cell body, soma and dendrites of neurons. 0.5 g Cresyl violet acetate crystal powder was dissolved in 500 mL of distilled water together with 1.25 mL glacial acetic acid using magnetic stirrer at 60°C until majority of crystals were dissolved. The solution was then filtered with Whatman filter paper and stored in an amber-glass bottle. Deparaffinizated and rehydrated sections were first washed with D.H2O and stained with 0.1% (w/v) CV staining solution for 50-60 min, dehydrated in gradient ethanol, cleared with xylene and staining was preserved using DPX mountant. The CV stained coronal sections were observed under light microscope and photomicrographs were captured (10 X and 40 X objective) throughout the stained sections for analyzing the morphological features of pyramidal neurons in the subiculum, hippocampal-proper region (CA1, CA2, CA3 and CA4) and the granule cells of DG region, various type of cells from other parts of the brain like FC, amygdala, cerebellum, thalamus, hypothalamus, layers of temporal and parietal lobe of the neocortex. Dead cells were identified morphologically by blebbing of plasma membrane, diffused pallor of eosinophilic background, alterations in size and shape of cells, vacuolation, chromatin condensation and condensed nucleus. The nuclei of the pyramidal and granule cells with well‑defined nuclear membrane and clearly visible nucleoli were considered as live cells. Also, cell density was evaluated by manual counting using Image J software. Approximately nine alternative/random brain sections were selected and stained. In this the entire section was screened for morphological changes. The data’s are later pooled from samples of n=6 animals in each group and is used for statistical analysis. Based on observation, the images were selected and projected in the results.
WESTERN IMMUNOBLOTTING ANALYSIS
Preparation of protein extract:
Total cellular protein extract from different brain regions were prepared by the following standard procedures. In brief, 10% (wt/vol) brain tissue homogenates were prepared by using ice-cold Radio Immunoprecipitation Assay (RIPA) lysis buffer (50mM Tris, 150mM NaCl, 1% triton-X, 0.5% sodium deoxycholate, 0.1% SDS and 1mM EDTA, pH: 8.0). The homogenate was kept on ice for 30 min and then centrifuged at 10,000 rpm for 30 min at 4°C in a microcentrifuge (Eppendorf Inc.). The clear supernatant was collected in a fresh tube and again centrifuged at 12,000 rpm for 15 min at 4°C. The supernatants was extracted and prepared in aliquots for further use, in order to avoid repeated freeze thaw of the samples. Aliquots of the cleared supernatants were subjected to limited proteolysis by inhibiting proteases (Final concentrations: 1mM of Phenylmethyl sulfonyl fluoride (PMSF), 0.5µg/ml of Leupeptin (Leu) and 0.5µg/ml of Aproptinin (Apr)). The remaining pellets, as well as the aliquots were stored at −80°C.
Protein estimation: Total protein concentration in the supernatant was estimated by the method of Lowry et al., (1951) using bovine serum albumin (BSA) as standard and measuring the absorbance at 640 nm with the help of microplate reader (Model, Bio-Rad).
Separation of proteins by gel electrophoresis and detection:
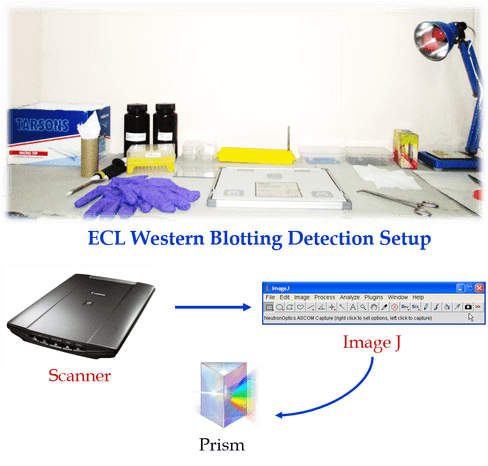
50µg of protein were aliquoted, resuspended with 4× Laemmle buffer (Final concentrations: 50 mM Tris pH 6.8, 2% SDS, 10% glycerol, 1% β-mercaptoethanol, 12.5 mM EDTA, 0.02% bromophenol blue), boiled for 5-10 min at 95°C and size fractioned by polyacrylamide gel electrophoresis (PAGE) using home-made 10% SDS polyacrylamide gels at RT. Proteins were transferred (300mA for 2 h, Hoefer SE300 miniVE) onto a Polyvinylidene difluoride (PVDF) membrane (0.2µM, Pall Corporation) using Towbin buffer (25mM Tris base, 190 mM glycine, 20% methanol, pH: 8.3); successful transfer was identified using a Ponceau Red solution (0.1% Ponceau, 1% Acetic Acid) to verify bands of various sizes of protein, which migrated through the PAGE. Membranes were then blocked using blocking buffer (freshly prepared 5% non-fat dry milk (or) 5% BSA in TBS-T (20 mM Tris, 136 mM NaCl, 0.1% Tween®20, pH 7.6)) for 2 h at RT and probed with one of the following specific primary antibodies (Target Proteins), diluted in primary antibody dilution buffer (1% BSA, 0.1% Gelatin, 0.5% Triton X-100, 0.05% sodium azide and 0.01% TBS, pH 7.4) at 4°C for overnight on a shaker. Membranes were washed (3X, 10 min) with TBS-T. Further, the membrane-bound primary antibodies were detected by respective secondary labeling with either goat anti-rabbit IgG (1:10,000, Cell signaling#7074) or rabbit anti-mouse (1:10,000, Cell signaling#7076) antibody linked to horseradish peroxidase (HRP) in secondary antibody dilution buffer (TBS-0.1% Tween®20, 5% glycerol, pH 7.4) incubating for 45 min at RT on shaker, then membranes were washed (3X, 10 min) with TBS-T. β-actin and Glyceraldehyde 3-phosphate dehydrogenase (GAPDH) used as an internal control. For GAPDH, rabbit monoclonal anti-GAPDH (14C10) antibody (1:10,000, Cell Signaling#3683) was used and diluted in TBST, incubated at RT for 45 min, washed (3X, 10 min) with TBS-T, and all blots were visualized with an enhanced chemiluminescence (ECL) kit according to the instructions of manufacturer (SuperSignal® West Femto Maximum Sensitivity Substrate, Thermo Scientific 34095). Finally, western blots were scanned and optical density of trace quantity for each band was measured using Image J (https://imagej.nih.gov/ij/) to provide quantitative values for relative expression.
Animals were perfused intracardially with PBS, for 2 min followed by 10% (w/v) neutral buffered formalin (NBF: 100ml formaldehyde (37-40% stock solution), 4g/L NaH2PO4, 6.5g/L Na2HPO4, 900ml H2O; pH 7.0) for pre-fixation of the tissues another 5 min. The brain was dissected out carefully and kept in ice-cold plate immediately according to the guidelines of Glowinski and Iversen (1966). The excised regions were isolated and washed with normal saline followed by 10% NBF in 1 X PBS and stored in 10% NBF overnight at room temperature (RT) for post-fixation. The tissues were dehydrated in gradient alcohol solutions (30%, 50%, 70%, 80% 90% and 100%). Dehydration was followed by clearing the samples in 2 changes of xylene (Sulphur free). Samples were then impregnated with 2 changes of paraffin-wax, then embedded and blocked out. Blocks were prepared and coronal sections of 5μm were made using rotary microtome (Leica RM 2255, Lab India) and mountated on 3-aminopropyltriethoxysilane treated slides and kept in 37°C overnight.
Hematoxylin and Eosin (H & E) staining
A histopathological study was conducted according to Li et al (1998). H & E staining used to evaluate age-associated pathological changes in Liver, Kidney and brain tissues from both control and RSV treated animals. Based on the SURS, selected paraffin sections were deparaffinized in xylene for 30 min, rehydrated in serial concentrations of ethanol solutions (100%, 90%, 80% and 70%) and washed with 1X PBS then placed in deionized water (D.H2O) for 5 min. Hematoxylin solution for 10 s and washed with running tap water for 5 min and washed with 90% ethanol then stained with 0.25% of eosin solution for 1 min, sections were dehydrated in graded ethanol (90% & 100%), cleared with xylene and coversliped with DPX. Stained sections were captured using light microscopy (Weswox Optik) at 10X and 40X magnification.
Cresyl Violet (CV) Staining
Aged rats with poor memory performance (as evidenced in RAM analysis) was chosen for analyzing age-associated pathological alterations in specific brain regions. Based on the SURS, random brain sections were made and stained for Nissl bodies with Cresyl violet (CV) to evaluate the morphological changes of the brain and also to localize the cell body, soma and dendrites of neurons. 0.5 g Cresyl violet acetate crystal powder was dissolved in 500 mL of distilled water together with 1.25 mL glacial acetic acid using magnetic stirrer at 60°C until majority of crystals were dissolved. The solution was then filtered with Whatman filter paper and stored in an amber-glass bottle. Deparaffinizated and rehydrated sections were first washed with D.H2O and stained with 0.1% (w/v) CV staining solution for 50-60 min, dehydrated in gradient ethanol, cleared with xylene and staining was preserved using DPX mountant. The CV stained coronal sections were observed under light microscope and photomicrographs were captured (10 X and 40 X objective) throughout the stained sections for analyzing the morphological features of pyramidal neurons in the subiculum, hippocampal-proper region (CA1, CA2, CA3 and CA4) and the granule cells of DG region, various type of cells from other parts of the brain like FC, amygdala, cerebellum, thalamus, hypothalamus, layers of temporal and parietal lobe of the neocortex. Dead cells were identified morphologically by blebbing of plasma membrane, diffused pallor of eosinophilic background, alterations in size and shape of cells, vacuolation, chromatin condensation and condensed nucleus. The nuclei of the pyramidal and granule cells with well‑defined nuclear membrane and clearly visible nucleoli were considered as live cells. Also, cell density was evaluated by manual counting using Image J software. Approximately nine alternative/random brain sections were selected and stained. In this the entire section was screened for morphological changes. The data’s are later pooled from samples of n=6 animals in each group and is used for statistical analysis. Based on observation, the images were selected and projected in the results.
WESTERN IMMUNOBLOTTING ANALYSIS
Preparation of protein extract:
Total cellular protein extract from different brain regions were prepared by the following standard procedures. In brief, 10% (wt/vol) brain tissue homogenates were prepared by using ice-cold Radio Immunoprecipitation Assay (RIPA) lysis buffer (50mM Tris, 150mM NaCl, 1% triton-X, 0.5% sodium deoxycholate, 0.1% SDS and 1mM EDTA, pH: 8.0). The homogenate was kept on ice for 30 min and then centrifuged at 10,000 rpm for 30 min at 4°C in a microcentrifuge (Eppendorf Inc.). The clear supernatant was collected in a fresh tube and again centrifuged at 12,000 rpm for 15 min at 4°C. The supernatants was extracted and prepared in aliquots for further use, in order to avoid repeated freeze thaw of the samples. Aliquots of the cleared supernatants were subjected to limited proteolysis by inhibiting proteases (Final concentrations: 1mM of Phenylmethyl sulfonyl fluoride (PMSF), 0.5µg/ml of Leupeptin (Leu) and 0.5µg/ml of Aproptinin (Apr)). The remaining pellets, as well as the aliquots were stored at −80°C.
Protein estimation: Total protein concentration in the supernatant was estimated by the method of Lowry et al., (1951) using bovine serum albumin (BSA) as standard and measuring the absorbance at 640 nm with the help of microplate reader (Model, Bio-Rad).
Separation of proteins by gel electrophoresis and detection:
50µg of protein were aliquoted, resuspended with 4× Laemmle buffer (Final concentrations: 50 mM Tris pH 6.8, 2% SDS, 10% glycerol, 1% β-mercaptoethanol, 12.5 mM EDTA, 0.02% bromophenol blue), boiled for 5-10 min at 95°C and size fractioned by polyacrylamide gel electrophoresis (PAGE) using home-made 10% SDS polyacrylamide gels at RT. Proteins were transferred (300mA for 2 h, Hoefer SE300 miniVE) onto a Polyvinylidene difluoride (PVDF) membrane (0.2µM, Pall Corporation) using Towbin buffer (25mM Tris base, 190 mM glycine, 20% methanol, pH: 8.3); successful transfer was identified using a Ponceau Red solution (0.1% Ponceau, 1% Acetic Acid) to verify bands of various sizes of protein, which migrated through the PAGE. Membranes were then blocked using blocking buffer (freshly prepared 5% non-fat dry milk (or) 5% BSA in TBS-T (20 mM Tris, 136 mM NaCl, 0.1% Tween®20, pH 7.6)) for 2 h at RT and probed with one of the following specific primary antibodies (Target Proteins), diluted in primary antibody dilution buffer (1% BSA, 0.1% Gelatin, 0.5% Triton X-100, 0.05% sodium azide and 0.01% TBS, pH 7.4) at 4°C for overnight on a shaker. Membranes were washed (3X, 10 min) with TBS-T. Further, the membrane-bound primary antibodies were detected by respective secondary labeling with either goat anti-rabbit IgG (1:10,000, Cell signaling#7074) or rabbit anti-mouse (1:10,000, Cell signaling#7076) antibody linked to horseradish peroxidase (HRP) in secondary antibody dilution buffer (TBS-0.1% Tween®20, 5% glycerol, pH 7.4) incubating for 45 min at RT on shaker, then membranes were washed (3X, 10 min) with TBS-T. β-actin and Glyceraldehyde 3-phosphate dehydrogenase (GAPDH) used as an internal control. For GAPDH, rabbit monoclonal anti-GAPDH (14C10) antibody (1:10,000, Cell Signaling#3683) was used and diluted in TBST, incubated at RT for 45 min, washed (3X, 10 min) with TBS-T, and all blots were visualized with an enhanced chemiluminescence (ECL) kit according to the instructions of manufacturer (SuperSignal® West Femto Maximum Sensitivity Substrate, Thermo Scientific 34095). Finally, western blots were scanned and optical density of trace quantity for each band was measured using Image J (https://imagej.nih.gov/ij/) to provide quantitative values for relative expression.
Immunofluorescence confocal microscopy
Based on the SURS, selected paraffin sections were deparaffinizated or rehydrated sections were first washed with PBS (pH 7.4), treated with antigen unmasking solution (Citrate buffer: 10mM Citric Acid, 0.05% Tween 20, pH 6.0) maintain at a sub-boiling temperature for 18 min and washed in PBS. For cytosolic proteins, sections were permeabilised with PBS-T (0.25% Triton-X 100), whereas for membrane bound proteins sections were permeabilised with PBS-T (0.25% Tween®20) was used. Sections were then blocked with blocking solution (2% BSA in PBS-T) for 30 min at RT. Sections were incubated with one of the following specific primary antibodies (Target Proteins) overnight at 4°C, washed in PBS (3x15 min). After PBS wash, followed by incubation with secondary antibodies, i.e., IgG conjugated to Alexa Fluor 594 (red) for another 1 to 2h at RT. After a PBS wash, sections were coversliped with mounting medium (9 parts of glycerol and 1 part PBS) which contain anti-quench agent (Ascorbic acid). Sections were illuminated by light with an excitation wavelength of 594nm (red) for primary antibodies. Sections were imaged using a LSM (Zeiss) confocal scanning microscope. Confocal images were acquired on an inverted laser scanning confocal microscope Carl Zeiss with 63X oil immersion lens. Images were taken using a ZEN 2011 software and analyzed with Image J software.
Double immunofluorescence confocal microscopy
Double immunofluorescent labeling of (Target Proteins) were performed on paraffin sections prepared as above. After the primary antibodies incubations the sections were incubated in a solution containing GFP diluted 1:100 in PBS containing 1% BSA for overnight 4°C. After a PBS wash, followed by incubation with secondary antibodies, i.e., IgG conjugated to Alexa Fluor 594 for red for another 1 to 2h at RT. After a PBS wash, sections were coversliped with mounting medium. Sections were illuminated by light with an excitation wavelength of 488 nm (green), and 594nm (red) for primary antibodies. Single and a series of optical sections were transferred separately to Channel 1 and Channel 2 to avoid crosstalk, and then superimposed. Green and red images were acquired simultaneously, presented either separately or as a superimposed image. Sections were imaged using a LSM (Zeiss) confocal scanning microscope. Confocal images were acquired on an inverted laser scanning confocal microscope Carl Zeiss with 63X oil immersion lens. Images were taken using a ZEN 2011 software and analyzed with Image J software
